Volunteers from Bike Winnipeg have been conducting spring counts of bicycle traffic since 2007 in order to provide solid information about the numbers of commuter cyclists in Winnipeg based on direct observation. During April, May and June of 2013 we completed 78 counts at 28 locations in Winnipeg. Since 2007 we have completed 462 counts at 84 locations.
Download the complete Winnipeg Bicycle Counts report.
Our analysis resulted in these findings:
Timing of Spring Weather Affects Cycling Levels
The analysis found that the timing of spring weather, measured as time since the last snow has melted, has a direct effect on the numbers of cyclists. This is a better measure of spring timing than the calendar month and provides a clearer annual trends in commuter cycling behaviour.
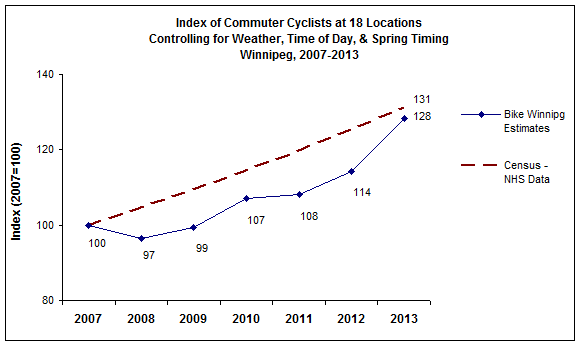
28% Increase in Commuter Cycling Since 2007
Based on our analysis, incorporating location, time of day, weather conditions and spring timing, the number of cyclists increased by an estimated 12% in 2013, compared to 2012. Since 2007 the number of commuter cyclists has increased by an estimated 28% or an annual average of 4.3% per year. This rate of increase is similar to the rate of increase based on the 2006 Census and the 2011 National Household Survey concerning the number of commuters using bicycles to travel to work, that worked out to 4.6% per year.

Commuter cycling in Winnipeg has increased 28% since 2007
- The number of cyclists increased more at locations that have benefited from cycling infrastructure improvements than at other locations.
- Locations where cyclists feel unsafe and where no improvements have been made, have not experienced similar growth; some have seen reduced traffic.
More than 13,000 Daily Bicycle Commuters in Winnipeg
- Average daily bicycle traffic (number of cyclists) traveling in and out of downtown Winnipeg during a typical weekday in May or June (24 hours) is estimated at 12,648.
- Assuming each cyclist travels both in and out of downtown, the number of downtown commuter cyclists is estimated at half of the total daily traffic or 6,324.
- Given that many commuter cyclists don’t travel downtown and that downtown commuters are about 48% of the total number of Winnipeg commuter cyclists, the number of bicycle commuters for the city as a whole is estimated at 13,200.
Sidewalk Riding Low Where Bike Paths Exist
Although cycling on sidewalks is illegal in Manitoba, except where explicitly permitted, many cyclists ride on the sidewalks, either for convenience or out of fear of riding in the street. The percentage of cyclists riding on the sidewalks has declined since 2008 and the rate of decline is greater since 2010.

At locations where there was a bike or multi-use path only 8% rode on the sidewalks in 2013
The decrease in sidewalk riding may be due to the increasing availability of bicycle or multi-user paths in Winnipeg. Sidewalk riding cyclists depends on the particular location, the amount of traffic and the choices that are available to them. At locations where there was a bike or multi-use path only 8% rode on the sidewalks in 2013.

Sidewalk riding cyclists depends on the particular location, the amount of traffic and the choices that are available to them
Helmet Use Higher on Roads than on Sidewalks
In 2013 69% of commuter cyclists wore helmets, down slightly from 2012. 78% of cyclists riding on the roads wore helmets compared to 55% of those riding on sidewalks.

In 2013 69% of commuter cyclists wore helmets, down slightly from 2012
Conclusions
- After taking into account location, weather conditions, spring timing and time of day, commuter cycling in Winnipeg has increased by 28% over the past five years, an average rate of increase of 4% per year.
- At some locations peak bicycle traffic exceeds 400 cyclists in two hours, or one cyclist every 15-20 seconds, during rush hour.
- The number of cyclists is increasing more at locations that have benefited from cycling infrastructure improvements than at other locations.
- At locations where cyclists feel unsafe and where no improvements have been made, there has been little growth and some cases of a decline in cyclist traffic.
- During May and June of 2013, approximately 6,300 cyclists commuted in and out of the downtown area of Winnipeg during weekdays, and throughout the entire city a total of about 13,200 cyclists commuted on a daily basis.
- More than half of cyclists ride on the sidewalks on busy arteries, bridges and underpasses, but where bike paths exist, less than 10% ride on sidewalks.
- 69% of commuter cyclists wear helmets, with women, and those riding in the street more likely to wear helmets than men and those riding on sidewalks.
Thanks as always to Bike Winnipeg director Jeremy Hull and all of the bicycle count volunteers who devote their time each year to make this important research possible.
The Winnipeg Bicycle Counts project relies heavily on the support of volunteers. To find out about this or other volunteer opportunities with Bike Winnipeg, please view our Volunteer page.