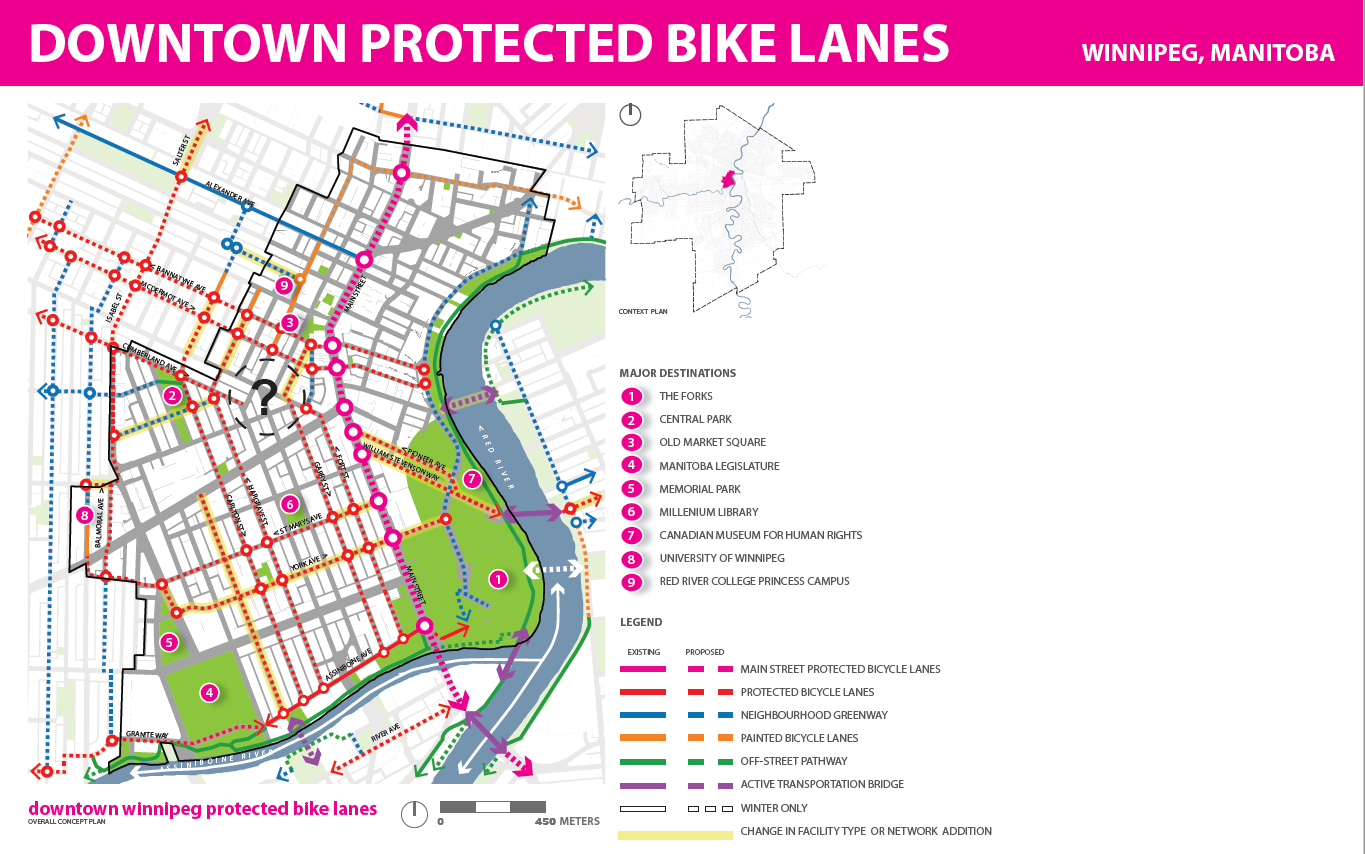
Downtown Separated Bicycle Lane Network
Despite having been identified as a short-term “quick win” that should be prioritized in the next one or two years.[1], construction of the city’s down town separated bike lane network is finally starting to take shape with the completion of the McDermot/Bannatyne Avenue protected bike lanes in 2018 (plus segments of the Princess, Notre Dame, Hargrave, and Carlton Protected Bike Lanes) and the expected completion of the Garry Street protected bike lanes in 2019.
Still, full build-out of the downtown separated bicycle lane network is not within the 3-year planning horizon of the 2018 Pedestrian and Cycling Program Action Plan, and even then the planned network will not provide the level of connectivity recommended in the Downtown by the Pedestrian and Cycling Strategies (400m grid width).[2]
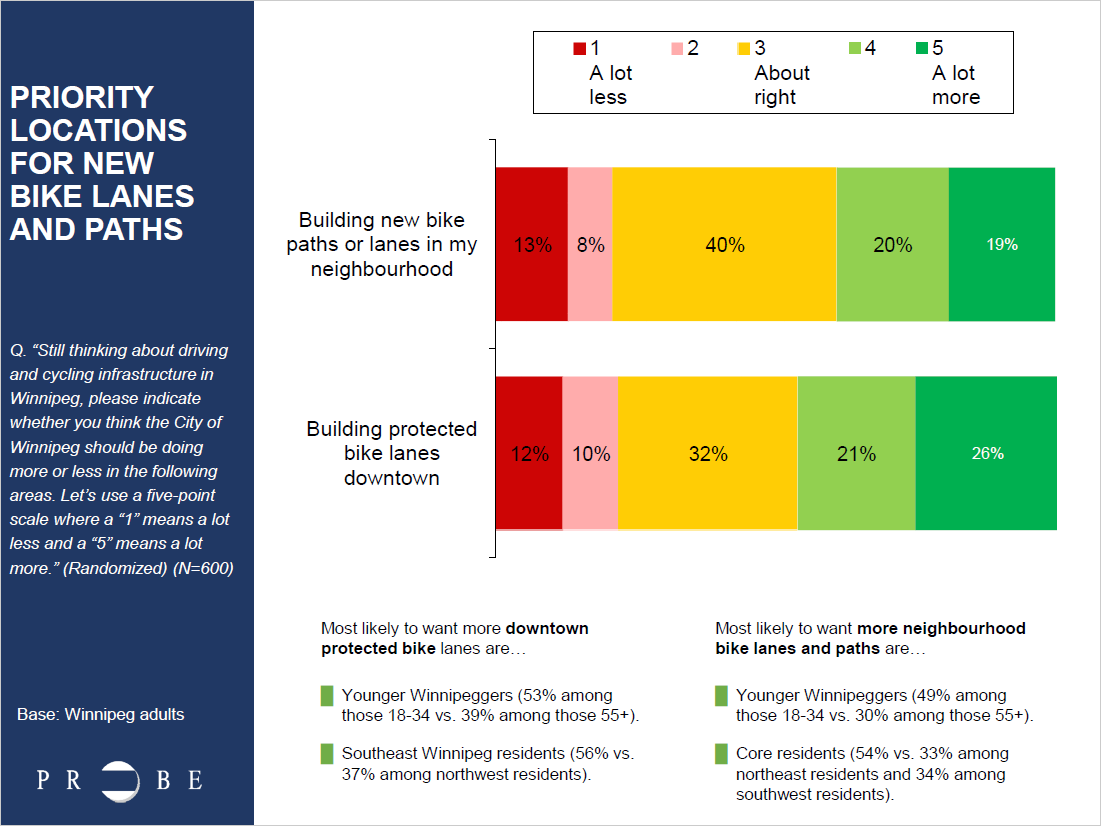
A June 2018 Probe Research poll found substantial support for installation of protected bike lanes in the downtown. When asked if they think the City of Winnipeg should be building more or less protected bike lanes in the downtown, almost half (47 per cent) of respondents said the city should be building more protected bike lanes downtown.
We urge the city to fast track development of the downtown separated bicycle lane network by committing to plan for all remaining segments (and proposed additions along St. Mary & York) in 2019, and by installing adjustable separated bike lanes in 2019/2020 to be followed with permanent installations as the roadways undergo planned renewals.
Case Study
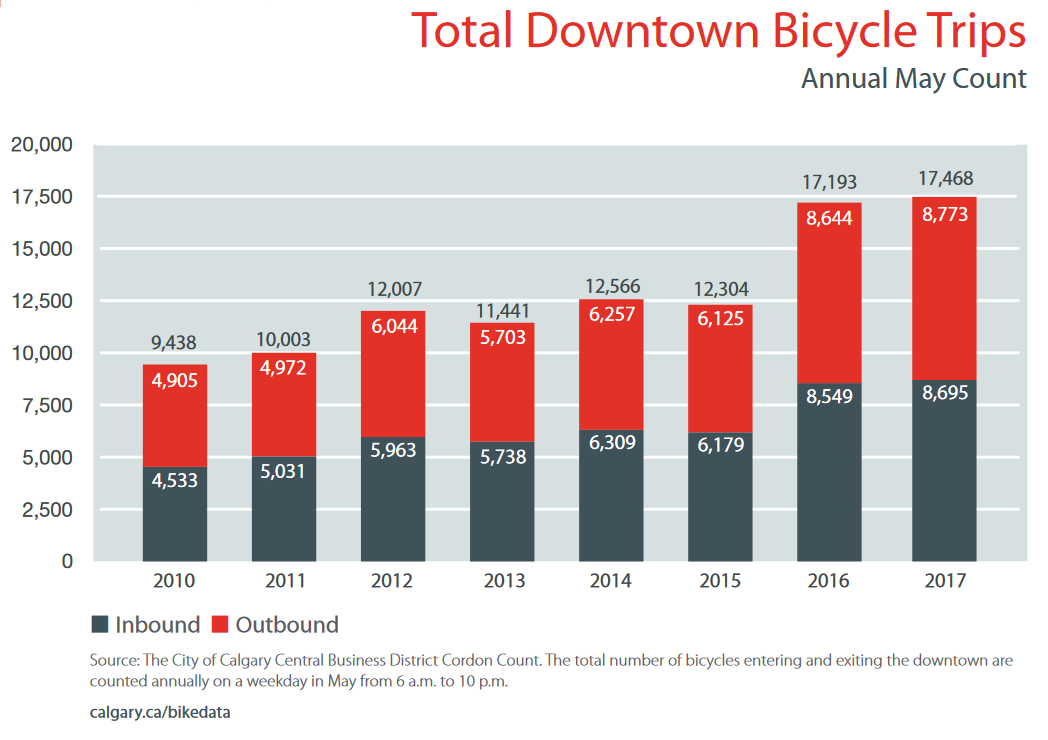
In 2015, the City of Calgary fast tracked the planning and installation of a five street downtown protected bike lane network using cheaply installed adjustable barriers (similar to those being piloted in Winnipeg right now).
Results:
- Ridership has tripled along the network.
- Bicycle trips into and out of downtown increased by 40% between the 2015 and 2016.
- Perception of safety of people cycling increased from 68% to 91%.
- People are going one or two blocks out of their way to use the cycle tracks.
- The highest ridership occurs where cycle track routes are closer together.
Footnotes
[1] Page 312, Pedestrian and Cycling Strategies, City of Winnipeg, 2015
[2] Page 135, Pedestrian and Cycling Strategies, City of Winnipeg, 2015