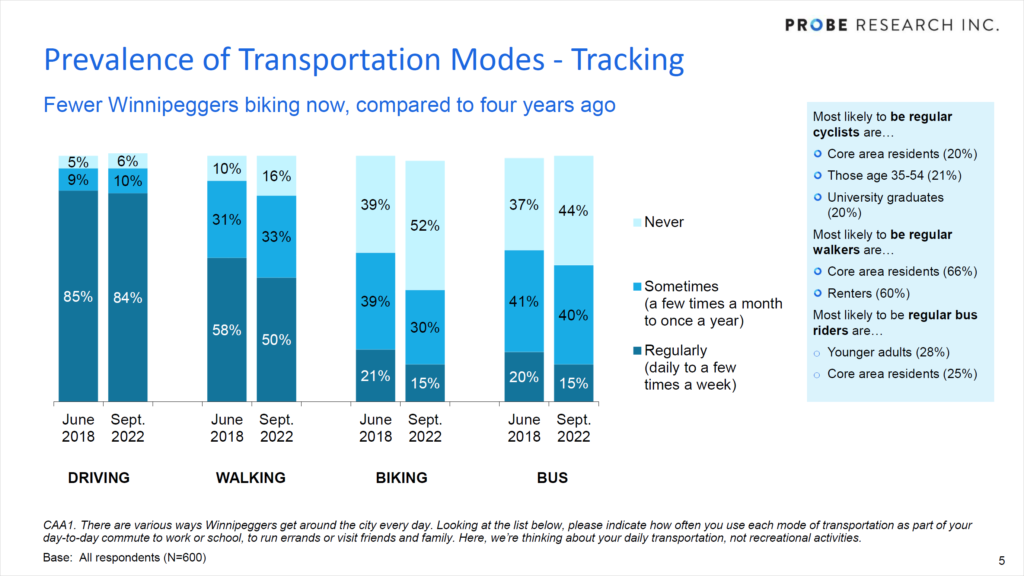
In September of 2022, Bike Winnipeg and CAA Mantioba engaged polling firm Probe Research to poll of Winnipegger’s on their transportation preferences as well as their preferences and concerns on the state of cycling in the city.
A main finding of the poll is that post Covid-19, people’s daily travel has decreased across all modes of travel when compared with rates found in a June 2018 survey asking many of the same questions. These shifts may reflect a lingering temporary shift in travel habits due to pandemic restrictions and work from home orders, or a more permanent change in travel as people change how and where they work. Time will tell, but very few restrictions remained in place at the time of this survey.
For driving, the decrease in daily driving seems to have manifested itself as a shift from daily travel into less frequent travel of a few times a week or less. In 2018, 63% of respondents said they drove on a daily basis and a further 23% report that they driver a few times a week. This drops to 51% driving daily in 2022 and 33% driving a few times a week. The drop in the rates of biking and busing follow very different patterns from the drop in the rates of driving.
The frequency of busing takes a far steeper decline in daily use, seeing double the decline in daily driving (12% in 2018 vs 8% in 2022) to that of driving or biking, but lower levels of frequency (a few times a week, once a month, …) remain unchanged.
The drop in people who report busing on a daily busing on a daily basis can be explained as a covid 19 aftereffect.
For biking, the frequency of daily usage takes a similar drop to that seen for driving (7% in 2018 dropping to 6% in 2018), but the frequency of people stating that they ride a few times a week has decreased by a third (from 15% in 2018 to just 10% in 2022). As people who report riding a few times a week are probably the most likely to increase their riding frequency and thus shift our of their car and onto their bikes, this reduction is particularly concerning. It is also a change that is hard to explain as a Covid effect, but may make sense when other results of the poll are considered.

A definite concern is the number of respondents who state that they never ride their bikes. This has grown from 39% of respondents in 2018 to 52% in 2022. and is fairly consistent across the various regions of the city. In contrast, the frequency of people who reported daily or regular cycling varied considerably by region, and can arguably be correlated to the degree of regional connectivity.
Desire for better bike storage points to concerns about theft
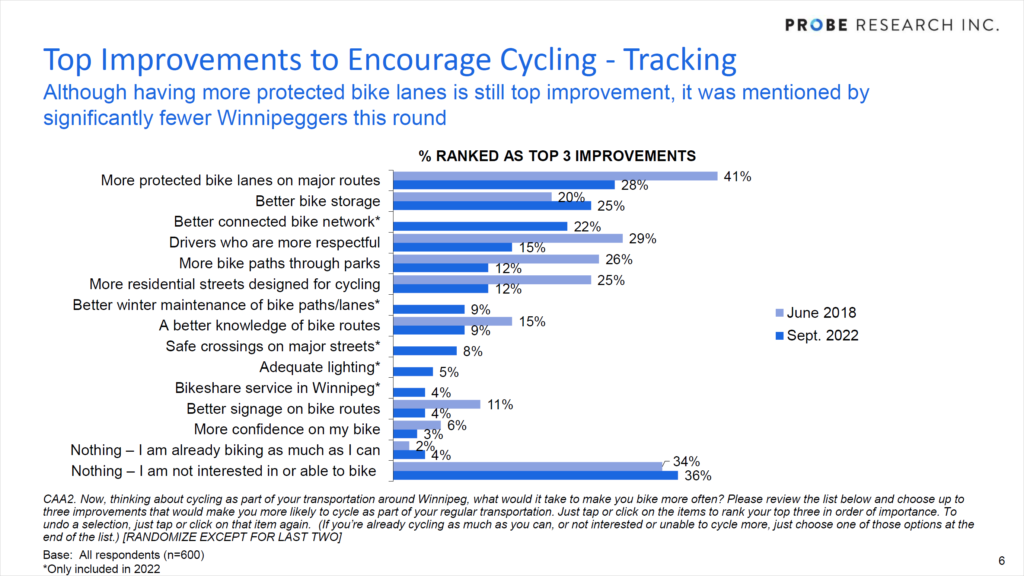
A second major finding of the 2022 survey is that the desire for better bike storage has become much more prevalent in the past four years. 25% of respondents have identified better bike storage as one or their top 3 improvements to get them biking more often, compared to 20% in 2018. This increase came despite the addition of three new categories to the question, which would be expected to decrease mentions compared to the 2018 survey. The increased desire for better bike storage is highlighted even more by the increase in the number of people ranking this as the top improvement to encourage more cycling. In 2018, just 5% of respondents ranked better bike storage as their top improvement to encourage cycling, but in 2022 this had doubled to 10%.

As we all know, bike theft has been rising in recent years, so a growing desire for better bike storage makes a lot sense as a means to lessen the risk of theft. It is also easy to postulate that a growing concern about bike theft may lead people who would otherwise ride a few times a week for errands, to work, or for occasional shopping or entertainment to skip those rides out of fear of having their bikes stolen.
It seems that if we want to get more people biking, we will need to deal with the issue of bike theft far better than we do at present.
Drop in ‘Few times a week’ cycling greatest in the core and northeast
As mentioned above, a large part of the drop in ‘regular cycling’ seen in the 2022 poll relates to the drop in the number of people reporting that they ride their bikes a few times a week. This drop was not at all uniform across the regions. While all regions saw a drop in the number of people who reported riding a few times a week, the core area saw a drop of 64% in the number of people reporting that they biked a few times a week compared with the 2018 survey, while those in the northeast reported a 54% drop between 2018 and 2022. In comparison, the numbers of people who reported riding a few times a week in 2022 dropped by 10%, 11%, and 18% among respondents in northwest, southeast, and southwest areas of the city, respectively.
Could concerns over bike theft be playing a role? It’s hard to say. Certainly one might expect more fear of bike theft in the core area. Interestingly, the core area of the city showed the lowest desire for better bike storage.
Growing unconnected suburbs and exurbs lead to less cycling
A final trend worth noting is the geographical differences in peoples reporting of how frequently they ride their bikes. Unsurprisingly, the highest rates for daily and regular (daily to a few times a month) cycling occur in the core of the city where people have shorter distances to travel and where there is a growing cycling network. This is especially true among people who reported cycling on a daily basis. In the core area and the southeast, the percentage of people who ride their bikes on a daily basis seems to have remained the same between 2018 and 2022, even as those areas grew in relation to the rest of the city. That’s at least one piece of good news that we can find in the survey.
Unfortunately, some of the areas where we see most of the growth in the city are also some of the areas where we see the lowest uptake in cycling. The northwest is a prime example. This growing area of the city has poor connectivity to the downtown, and low rates of cycling (2% daily, 9% a few times a week) to match. Most of the growth in this area would have been on the periphery of the city, necessitating longer trips across some of the least connected parts of the city. With that in mind, it’s not hard to see why the city is seeing a decreasing share of trips being taken by bike.
We would like to acknowledge that this project was undertaken in partnership with CAA Manitoba, and that funding was provided by the Province of Manitoba through its Building Sustainable Communities program and through the donations of members like you. Thank you!
Further Reading
CAA Manitoba / Bike Winnipeg September 2022 Omnibus Survey Report
CAA Manitoba / Bike Winnipeg September 2022 Omnibus Survey Tables
